
 Table of Contents Watch What I Do
The PURSUIT visual shell contains a Programming by Demonstration (PBD) interface to help solve this problem. In a PBD system, users execute actions on examples and the system constructs a general program. Such systems enable users to create general procedures without having special programming skills. They are easy to use because users operate the way they normally do in the interface. Unfortunately, they have limitations: they can infer incorrectly; most display no static representation of the inferred program; and many provide no editing capabilities. This makes it difficult for users to know if the system has inferred correctly and to correct any errors. It also makes it difficult to revise or change a program.
To address these problems, PURSUIT introduces a novel graphical representation of the program while it is being written. Programs are represented in a state-based visual language in which data objects, such as files and folders, are represented as icons and operations are represented by the changes they cause to data icons. This chapter discusses this approach.
Finally, providing a representation of the program during the demonstration provides the user with a source of feedback. Feedback in a PBD system is the form of communication between the system and the user. It serves to inform the user of the system's inferences; to enable the user verify these inferences; and to obtain guidance from the user as to the salient features of the example over which to generalize. There are many forms that this feedback can take: dialog boxes (e.g. property sheets in SmallStar (Chapter 5)); questions and answers (e.g. Peridot (Chapter 6) and Metamouse (Chapter 7)); textual representation of the code (e.g. Tinker (Chapter 2) and SmallStar(Chapter 5)); changing the appearance of actual interface objects (e.g. anticipation highlighting in Eager (Chapter 9)); animation (e.g. rehearsals in Rehearsal World (Chapter 4)); and sound (e.g. Mondrian (Chapter 16)).
Our approach has several benefits over these forms of feedback. Unlike dialog boxes and the question and answer style, it is not disruptive, since the user does not need to respond to it. Unlike programs represented in a textual language, it does not require the user to learn a new language that is very different from the interface. Unlike anticipation highlighting and animation, there is a static representation for users to examine. Having a good visual representation of the developing program, therefore, is easy to understand, not disruptive and gives the users full knowledge of the system's inferences.
Another reason for using a visual language is that visual programs are easier to understand than textual ones, especially for short programs [Cunniff 87]. Many of the problems with visual languages, such as scalability, won't arise in the visual shell domain because most programs users tend to write are relatively short and simple. They are usually no more than a page in length and often do not contain nested loops or nested conditionals [Botzum 92].
The benefits of the language described here are further discussed below.
The language contains two basic data types: files and folders. These are represented using familiar icons. Sets of data objects are represented by overlaying two icons of the same type and offsetting them by some small distance (see Figure 1). In order to allow for abstract sets of objects, graphical constructs called attributes are attached to set icons. Attributes constrain the objects in the set to have a particular value for a certain property, such as their date of modification (Figure 2). Attributes serve to indicate the underlying PBD system's inferences. They also allow users to specify explicitly the desired properties of data objects.
Associated with each data object is a set of graphical properties, such as its location, icon appearance, name, etc. These graphical properties represent properties
Figure 1. The representation of the basic data types in the visual language: (a) a file; (b) a folder; (c) a set of files; (d) a set of folders.
(a) (b) (c) (d)
Figure 2. Attributes attached to set icons constrain the objects in the set to have particular properties. They are also used to depict system inferences. For example, the first set (a) contains all those files whose name ends in ".tex". The second set (b) contains all those files edited before June 30, 1992.
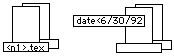
(a)
(b)
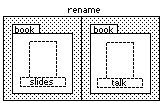
of the real object in the interface. An operation is shown by the changes it causes to the graphical properties of data objects. Two panels are used to represent an operation: the prologue, which contains the data objects before the operation has occurred; and the epilogue, which contains the data objects after the operation has occurred and shows any changes to the objects caused by the operation. An operation's representation, therefore, looks very much like the changes the user sees in the real user interface when executing the operation (e.g. Figure 3).
A program is a series of operation panels concatenated together, along with representations of control constructs such as loops and conditionals. However, because two panels per operation may result in long, space inefficient scripts, the language generator contains heuristics, based on those of Chimera (Chapter 19), for making programs more concise. For example, when the epilogue of an operation contains the prologue of the subsequent operation the two panels may be combined into one. Also, when the prologue of an operation contains no useful information it may be omitted.
The representation language is very similar to the editable histories of Chimera (Chapter 19). However, there are many notable differences between the two languages. First, Chimera uses actual screen images in its histories. Panels are snapshots of portions of the screen highlighting important objects.
Figure 3. The graphical representation of the operation rename slides talk. The first panel shows the icon representing the file slides before it is renamed. Icon type and color (here depicted by the dashed outline of the icons) are used to uniquely identify an object. The second panel shows the same file icon after the rename operation. Notice that the file's name has changed. This change represents the rename operation.
PURSUIT
uses a more abstract representation. What appears in a script is an iconic
representation of what appears on the screen. Another difference is how the
contents of a particular panel are determined. In Chimera, a panel contains not
only the objects involved in the operation, but also nearby objects. This is
necessary to provide contextual information in order to identify the objects of
interest. In PURSUIT, only the objects involved in an operation are depicted in
a panel. This difference may be due to the differences in domains of the two
systems. In a drawing domain, objects may not be uniquely identifiable by
themselves (e.g., two squares). In PURSUIT, the iconic representation of an
object along with its properties uniquely identifies it. The difference in
domains also accounts for another difference in the two representations:
Chimera histories necessarily preserve spatial relationships. These
relationships are not necessary, and therefore omitted, in PURSUIT. Finally,
scripts in PURSUIT can be generalized, and contain textual information to
convey these generalizations. Chimera only allows users to specify objects to
be arguments to a macro derived from the history. No generalization mechanism
is provided. The differences between PURSUIT and Chimera, as well as unique
features of the representation language, are illustrated in the following
example.
Figures 4-6 show a simulation of the developing visual script during the demon-
Figure 4. The copy operation. The attributes on the files set icon indicate the inferences the system made: all copied files have a name of the form <n1>.tex.
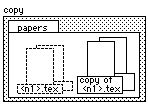
stration.
The first panel (Figure 4) appears after the user opens the ``papers'' folder,
selects all those files to be copied and copies them. Notice that the copy
operation is represented with only one panel. This is because the prologue for
the copy operation provides no extra information than the epilogue already
provides. Therefore, the first panel is redundant and is omitted. This is an
example of a heuristic to make the visual representations concise.
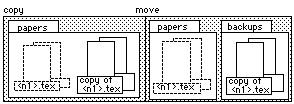
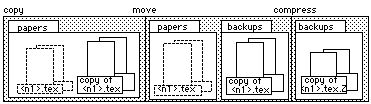
After the user moves the copies by clicking on them and dragging them to the ``backup'' folder, the new panel in Figure 5 appears depicting the move. Only one panel is added to illustrate the move, since the epilogue of the copy contains the prologue of the move operation. Finally, the user selects all the copies and compresses them. Figure 6 shows the completed program.
Using icons to represent data minimizes the use of explicit variables and assignment statements. This makes programs more concrete. In addition, data icons are very similar in appearance to the desktop objects they represent. Languages that represent data as closely as possible to the real objects are easier to understand [Hutchins 86].
Similarly, operation representations are easy to understand because the changes in objects in a program mirror the changes in the actual desktop objects when the operations are executed. Also, by representing operations in this familiar way, users do not need to learn special ``code'' or languages to understand a program. In essence, programs become symbolic representations of changes to data over time.
Finally, the use of attributes and set objects also helps to minimize the use of traditional control structures, such as loops and conditionals. Experience has shown that novices often have difficulty understanding these types of program constructs.
Currently, the language is being implemented as part of the PURSUIT [Modugno 93] interface. Using this prototype, we are exploring heuristics, such as when to omit prologue panels and when to combine several operations into a single panel, to make the visual representation more concise. In order to allow for more general programs, we have designed representations of control constructs such as explicit loops and conditionals. We are also extending the language to include representations of other objects, such as dialog boxes, windows and menus. Because we would like the visual language to include representations of utilities that users may add to the system, we have designed a simple declarative language for specifying the graphical representations of operations. This enables the visual language to be extended easily. Finally, in order to allow the user to change or update a script, we are designing a graphical editor for the visual language.
Table of Contents Watch What I Do